If I asked ten people who the best QB in the league was regardless of age I doubt I'd get a consensus answer. However, if I asked those same ten people who the best 10 QBs are, almost everyone would agree it's Aaron Rodgers, Drew Brees, Peyton Manning, & Tom Brady. Talent wise there's not much difference between the 4 of them. On the other hand the best receiver in the league is Calvin Johnson without argument.
For the sake of argument lets say the top 4 quarterbacks & receivers are ranked as such:
For the sake of argument lets say the top 4 quarterbacks & receivers are ranked as such:
| 1. Aaron Rodgers 2. Drew Brees 3. Peyton Manning 4. Tom Brady | 1. Calvin Johnson 2. Brandon Marshall 3. AJ Green 4. Dez Bryant |
So by the traditional ranking system listed above it would make sense that the #1 QB & the #2 WR should be better than the #4 QB & #1 WR. However, I'm sure any NFL fan would prefer Calvin Johnson/Tom Brady to Aaron Rodgers/Brandon Marshall. This naturally makes sense since as fans we naturally group players of similar talent together. So when we look at lists like this, generally it makes more sense to order them like this:
| Quarterbacks | Recievers |
| Tier 1: Rodgers Brees Manning Brady | Tier 2: Romo Luck Rivers Newton | Tier 1: Calvin Johnson | Tier 2: Brandon Marshall AJ Green Demaryius Thomas Dez Bryant Julio Jones |
Though you personally might have different players in the Tier 2 categories above, its safe to say that the difference between the #4 & 5 QB is huge - likewise with the #1 & 2 receiver.
So, whats the point I'm trying to make? You shouldn't be looking at a list as a strict numeric ranking (i.e. ESPN Top 200). Instead of going into the draft looking for a top ## receiver, look for a tier ## receiver.
So ESPN and other fantasy sports websites don't break players up by tiers so my goal was to develop a purely quantitative measure of placing players into tiers.
I haven't had the chance to do tier rankings for every single position, but here's what I did to rank the top 30 receivers. I chose to cut off at 30 since I play in a 10 team, 3 WR league so at worst a team would be (ideally) be starting the 30th ranked receiver. The first thing I did was pull the projected WR points from FantasyPros, a website that consolidates rankings from ESPN ,Yahoo, etc.
In order to create tiers I used a 1-dimensional K-Means Clustering Algorithm. This Princeton Lecture does a fairly good job of explaining it. In short, K-Means is an iterative algorithm that places a set of data points into K groups such as that each data point is closest the average of it's own group.
One of the main issues with K-Means (vs. something like a Gaussian Mixture Mode) is the ambiguity in determining the value of k (or in our case the amount of tiers). Ideally you want the the least amount of groups that can effectively explain the data. In this case I used the Elbow Method.
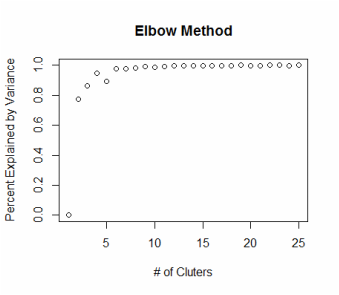
| Basically I looked at the % Explained by Variance (Sum of Squares between Groups/Total Sum of Squares). From there, you look at the "Elbow" - the point at which adding another cluster causes minimal difference in the amount of Percent Explained by Variance. Here we see that value at 6 clusters, however to be safe I went ahead with 7 clusters for the actual analysis. |
K-Means is a very rudimentary clustering algorithm, and isn't without its problems (as illustrated above). A big issue with K-Means, especially in small samples, is that its highly dependent on the initial random values to start the iterative process. What I found is very different tiers every time I ran the analysis. In order to combat this I ran the K-Means analysis 25 times and used the results that had the largest Percent Explained by Variance. Here's what I found:
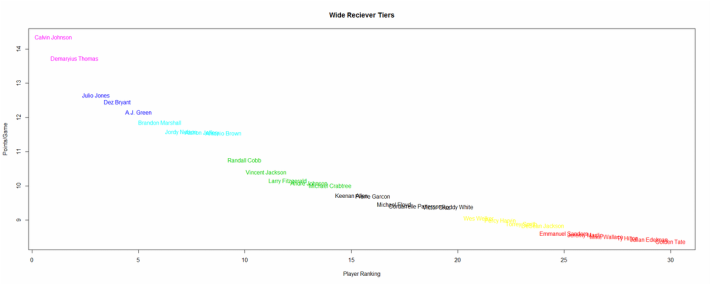
I apologize about the readability of the draft, this was my first time using R, and I'm figuring out the nuances of it. When I post a more holistic tier list it'll be much more presentable, but anyways the tiers are:
| Tier 1: Calvin Johnson Demaryius Thomas Tier 2: Julio Jones Dez Bryant A.J Green Tier 3: Brandon Marshall Jordy Nelson Alshon Jeffery Antonio Brown | Tier 4: Randall Cobb Vincent Jackson Larry Fitzgerald Andre Johnson Michael Crabtree Tier 5: Keenan Allen Pierre Garcon Michael Floyd Cordarrelle Patterson Victor Cruz Roddy White | Tier 6: Wes Welker Percy Harvin Torrey Smith DeSean Jackson Tier 7: Emmanuel Sanders Jeremy Maclin Mike Wallace Ty Hilton Julian Edelman |
The next question is how can use this tier rankings to your advantage? Well, you know there's minimal difference between the top of a tier and the bottom, so you can draft accordingly. For example lets look at the average draft position (ADP) of the first four tiers
| Tier 1: Calvin Johnson (5) Demaryius Thomas (10) Tier 2: Julio Jones (20) Dez Bryant (11) A.J Green (14) | Tier 3: Brandon Marshall (18) Jordy Nelson (22) Alshon Jeffery (25) Antonio Brown (26) | Tier 4: Randall Cobb (28) Vincent Jackson (32) Larry Fitzgerald (34) Andre Johnson (36) Michael Crabtree (46) |
So just looking at this tells you that Julio Jones is being underdrafted while Dez is going way too high. I included Tier 4 in here since there's a huge dropoff between Tier 3 & 4 (apparent in the graph above). Cobb's ADP is 28 while Brown's is 26. Cobb is projected 10.76 points a week while Brown is projected 11.54. Michael Crabtree (ADP 46, Tier 4) is projected 10.01 points a week - roughly the same difference between Brown & Cobb except you're getting him 20 picks later around the same ADP as Wes Welker (ADP 42, Tier 6, 9.06 pts/week).
I'll get a fully organized tier list up later this week, complete with ADP comparison and whatnot, but I just wanted to introduce tier based drafting, and K-Means clustering. I hope you enjoyed this piece and would love to hear any sort of feedback you have.
 RSS Feed
