As “MoreyBall” has gotten more popular we sees teams value 3&D guys, power forwards that can stretch the floor, and just shooting in general a lot more than in the past. If you see James Harden’s shot chart you see that he basically only shoots 3 pointers and layups – and it makes sense why. ESPN, Grantland, TNT and whatever else always stress that long 2s won’t win you games. Anyone that’s played NBA 2k can tell you how many times they’ve heard Doris Burke say the long 2 is the worst shot in the game.
So I wanted to see where the best teams in the league shooting from and whether or not long 2’s are actually that detrimental to team success. I took the shooting data from BasketballReference and ran a linear regression with winning percentages of every team the past 5 years and found this:
So I wanted to see where the best teams in the league shooting from and whether or not long 2’s are actually that detrimental to team success. I took the shooting data from BasketballReference and ran a linear regression with winning percentages of every team the past 5 years and found this:
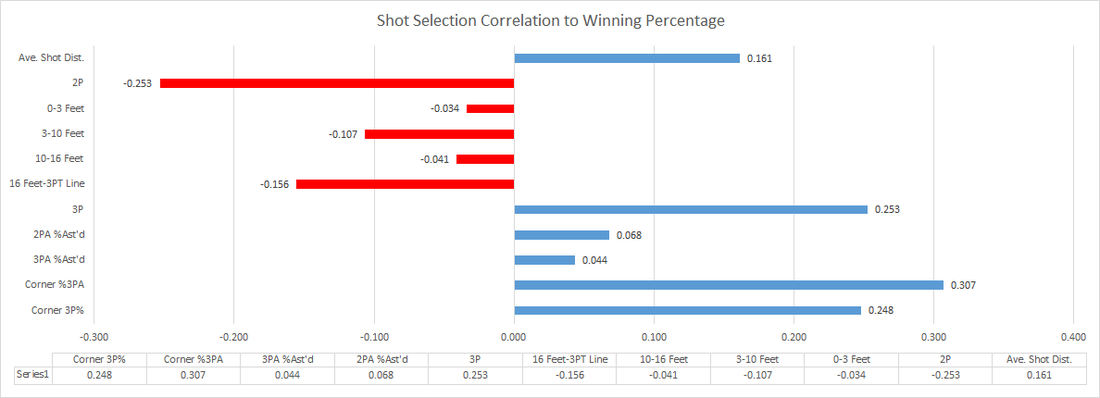
Note that a correlation value (r, Pearsons Value) of 1 is considered a perfect match, however in most real life situations that’s near impossible. A negative correlation value means that it’s inversely proportional to winning percentage. In a sport as volatile as basketball I certainly wouldn’t expect any values close to 1, but the correlations we see in the above graph are very low. The highest value we see is the correlation coefficient for percentage of 3 point attempts from the corner. Basically, theirs is little to no correlation as to where a NBA is getting its shots and its winning percentage – at least in the regular season.
Obviously this certainly isn’t enough data to say shot location doesn’t matter, but it might suggest that it doesn’t matter as much as we may think.
I wanted to check out the flipside of the data since I wasn’t satisfied with the statistics the offensive side showed so I ran a similar correlation except now I looked at where are opponents of teams with high winning percentages getting their shots from I found this:
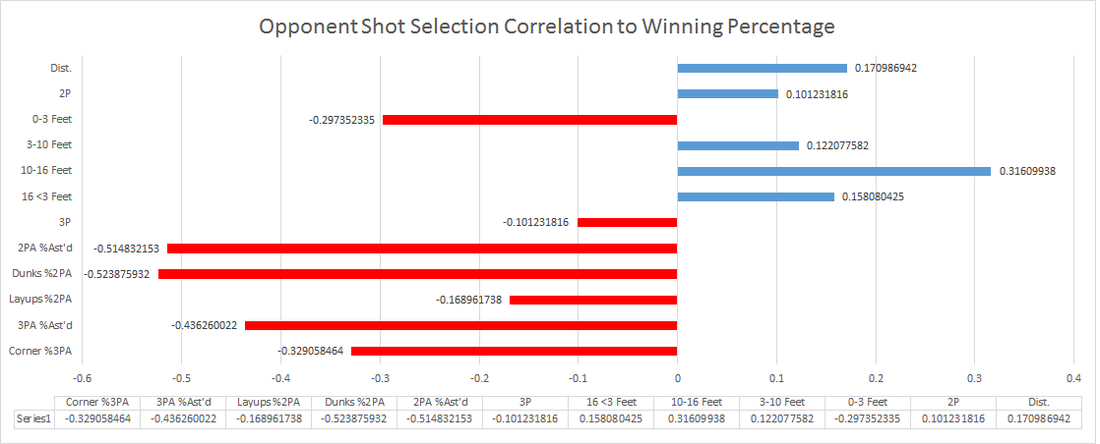
Now we start to see a lot stronger correlations, but again it wasn’t exactly what I expected. Teams that win a lot don’t necessarily force their opponents to shoot long 2’s (though the correlation coefficient suggests it does help). Unsurprisingly teams that allow a large percentage of dunks aren’t winning games, but you certainly didn’t need a graph to tell you that. However, teams that win aren’t giving up assisted shots (both 2PAs and 3PAs). Again just as before, this isn’t enough data to definitely make any conclusions, but it does suggest that teams should aim to take away assisted shots.
In 2014 the teams that did the best in forcing unassisted baskets were the Phoenix Suns and Portland Trailblazers. Both teams were known for closing out hard on all perimeter shots in an effort to force dribbles inside. Both teams are both top 10 in percentage of 2 pointers, 0-3 foot shots and 3-10 foot shots allowed.
Since the defensive data was interested I took a look at FG% allowed from different spots on the floor. Up until now we’ve just been looking at where teams are shooting from – completely independent from whether they’re making those shots or not.
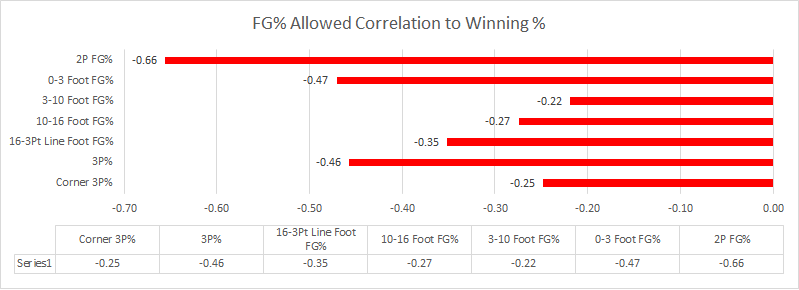
So when looking at FG% we’re obviously going to see higher correlations as if you’re making more shots you’re probably winning the basketball game. The lower correlation for Corner 3 point percentage can likely be attributed to the fact that most corner 3s are wide open and NBA players generally hit open shots at the same percentage. The other big correlation we see is with 3P% which goes back to closing out hard on 3 point attempts. There’s also a big correlation between 0-3 foot FG% and winning percentage which suggests that having a good rim protector is just as important as popular opinion suggests. I went back to the Portland and Phoenix data and found Portland was 3rd in FG% from 0-3 feet (Phoenix was 16th).
In conclusion offensively, there doesn’t seem to be much correlation between winning percentage and shot selection suggesting that a team that is shooting a lot of 2pt jumpers isn’t in as much as trouble as we’d like to believe. Defensively there definitely is a correlation and seems to suggest defenses focused on closing out against shooters and consequently giving up shots at the rim are doing better.
I hope to run more correlations like this in the future in an effort to understand the quantitative components that go into a winning team. Anyways I hope you guys enjoyed this and if you have any feedback that’d be awesome!
 RSS Feed
