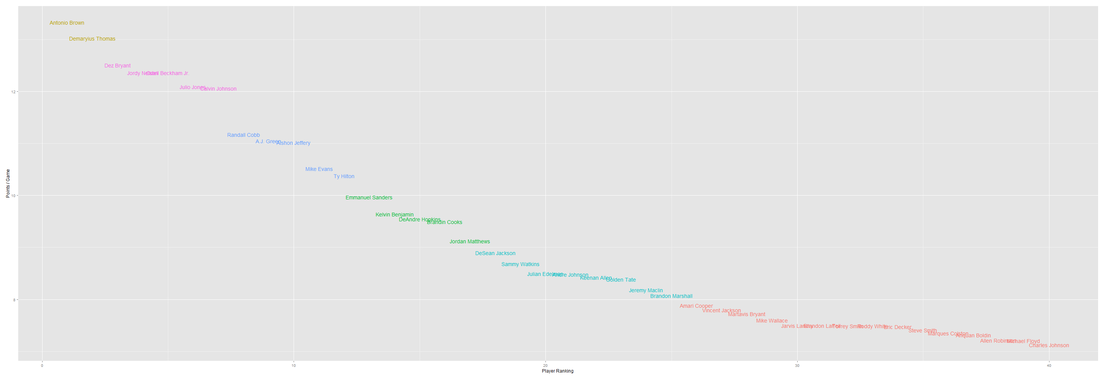
Below is a graph detailing the 6 tiers I've split the top 40 wide receivers into. The tiers are listed in a table below the graph as well
| Tier 1 | Tier 2 | Tier 3 | Tier 4 | Tier 5 | Tier 6 |
|---|---|---|---|---|---|
| Antonio Brown | Dez Bryant | Randall Cobb | Emmanuel Sanders | DeSean Jackson | Amari Cooper |
| Demaryius Thomas | Jordy Nelson | A.J. Green | Kelvin Benjamin | Sammy Watkins | Vincent Jackson |
| Odell Beckham Jr. | Alshon Jeffery | DeAndre Hopkins | Julian Edelman | Martavis Bryant | |
| Julio Jones | Mike Evans | Brandin Cooks | Andre Johnson | Mike Wallace | |
| Calvin Johnson | Ty Hilton | Jordan Matthews | Keenan Allen | Jarvis Landry | |
| Golden Tate | Brandon LaFell | ||||
| Jeremy Maclin | Torrey Smith | ||||
| Brandon Marshall | Roddy White | ||||
| Eric Decker | |||||
| Steve Smith | |||||
| Marques Colston | |||||
| Anquan Boldin | |||||
| Allen Robinson | |||||
| Michael Floyd | |||||
| Charles Johnson |
Just some additional notes:
I'll do a full analysis with the tiers vs ADP vs expert rankings later, but just some key players to watch out for:
Some notes on how the data was collected:
- Mike Evans/TY Hilton can be seen as Tier 3B. There's a decent size gap between them and Alshon, but still have enough seperation from Emmanuel Sanders.
- Take the table tier list in context with the graph, especially with the later tiers. Once you get that far in its a lot of luck.
I'll do a full analysis with the tiers vs ADP vs expert rankings later, but just some key players to watch out for:
- Demaryius Thomas is projected 0.5 pts/game more than Dez, but Dez has a higher ADP ranking (8 vs 11)
- FantasyPros projections have the following WRs ranked by ADP from 18-24, respectively: Julio Jones, Calvin Johnson, Jordy Nelson, AJ Green, Randall Cobb, Alshon Jeffery & TY Hilton. Jordy is projected the same amount of points as OBJ and more points than Megatron/Julio. The difference between the bottom of Tier 2 (Calvin Johnson) and the top of Tier 3 (Randall Cobb) is an enormous 0.8 points/game.
Some notes on how the data was collected:
- I used the Elbow Method just as I did last year to determine the amount of Tiers (k value) needed to explain the data
- Ran the K Means test 100 times and took the result that had the lowest variation within groups as compared to between groups
- The data was visualized via R's ggplot2 package
 RSS Feed
